






Collapse of Critical Zones Triggers Wave of Forced Selling
Bitcoin’s drop below the psychological $85,000 level triggered a massive wave of liquidations across the crypto derivatives market. In less than 24 hours, more than $2 billion worth of positions were wiped out, marking one of the most intense deleveraging episodes in recent weeks.
Bitcoin attempted to hold the $85,000 range early in the week, but lost momentum and ultimately slid to touch the $81,600 zone during intraday trading. This move underscores the fragility of technical structures amid global liquidity pressures.
Dominance of Long Liquidations Signals Leveraged Buyer Panic
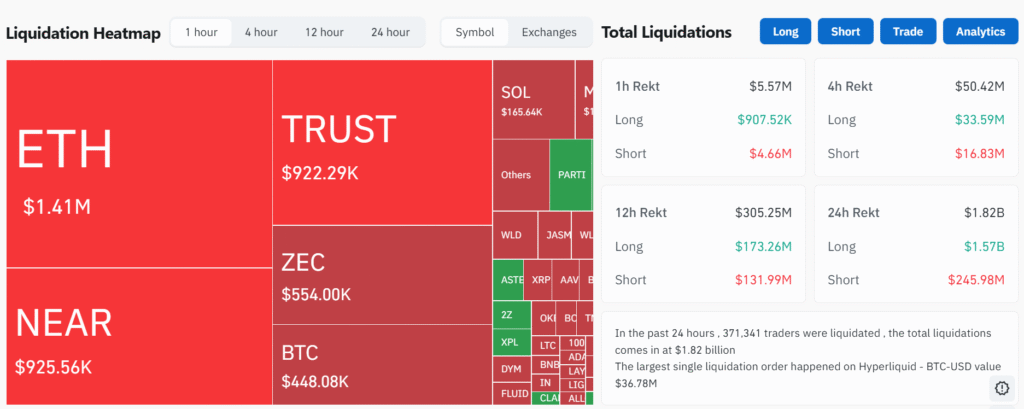
CoinGlass data reveals that the vast majority of losses stemmed from aggressive long positions. Of the total liquidations, approximately $1.86 billion came from longs, while short positions accounted for only around $140 million.
The pattern did not take the form of a single vertical plunge, but rather a cascading series of liquidations as Bitcoin broke through several support levels in succession. This dynamic reflects a systematic distribution of pressure rather than a fleeting moment of panic.
Exchanges with the Largest Exposure
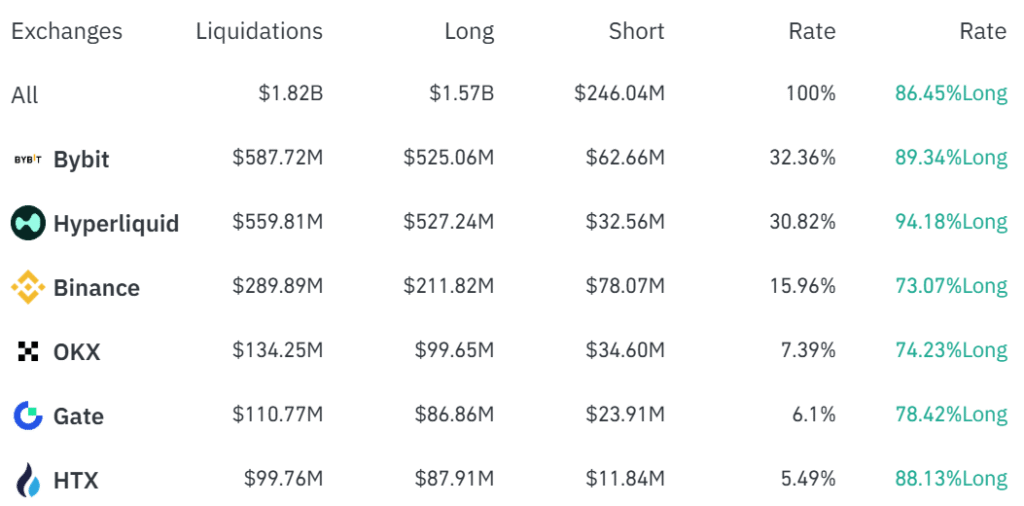
Liquidation pressure was most heavily concentrated on Bybit and Hyperliquid, which together accounted for the largest share of forced closures over the latest observation period. Based on recent data, the distribution of liquidation value across major exchanges is as follows:
- Bybit: $587.72 million (Long $525.06 million | Short $62.66 million) - 89.34% from long positions
- Hyperliquid: $559.81 million (Long $527.24 million | Short $32.56 million) - 94.18% dominated by long positions
- Binance: $289.89 million (Long $211.82 million | Short $78.07 million) - 73.07% long positions
- OKX: $134.25 million (Long $99.65 million | Short $34.60 million) - 74.23% long positions
- Gate: $110.77 million (Long $86.86 million | Short $23.91 million) - 78.42% long positions
- HTX: $99.76 million (Long $87.91 million | Short $11.84 million) - 88.13% long positions
In aggregate, total liquidations across exchanges reached $1.82 billion, with $1.57 billion originating from long positions and $246.04 million from shorts. This composition confirms that the main pressure stemmed from leveraged buy positions failing to maintain required margin levels.
Market Sentiment Shifts to Extreme Fear
The Crypto Fear & Greed Index now sits in the 10-15 range, falling into the “Extreme Fear” category. This represents one of the lowest levels in recent months, in stark contrast to the “Greed” conditions recorded less than a month earlier.
This dramatic reversal indicates a shift in investor behavior from aggressively chasing momentum to adopting a defensive, capital-preservation approach.
ETFs Lose Inflows as Price Buffers Thin
Downside pressure was further aggravated by outflows from US-based spot Bitcoin ETFs, which have exceeded $3 billion throughout November. While these instruments previously acted as a liquidity cushion during corrections, they are no longer providing significant support against derivatives selling pressure.
As a result, each liquidation wave has had a more direct impact on spot prices, amplifying intraday volatility.
Futures and Options Structures Signal Defensive Posture
Funding rates across exchanges have hovered near neutral territory, indicating a cooling in speculative leverage demand. Open interest has also retreated from peaks recorded in September and October, showing that many participants have exited high-risk exposures.
In the options market, implied volatility is reflected in Deribit’s DVOL index climbing to the low-60s, accompanied by a strong hedging bias. Put option premiums are trading higher than calls, signaling that downside protection remains the primary concern.
This structure creates a short-gamma dealer environment that has the potential to accelerate price moves as Bitcoin approaches key technical levels.
Strategic Price Zones in Focus
The $85,000 level has now turned into primary resistance. As long as the price fails to reclaim this area, downside risks remain open.
To the downside, the $82,000 - $79,000 range serves as a critical liquidity cluster and psychological support. A decisive break below this zone could open the path toward lower territory.
Meanwhile, the $90,000 - $94,000 zone remains a recovery target should sentiment improve, given the substantial options open interest concentrated in that area.
Macro Factors Add to Headwinds
A strengthening US Dollar Index and 10-year Treasury yields hovering around 4.1%-4.2% have created an unfavorable backdrop for high-risk assets. In this environment, Bitcoin is once again being traded as a high-beta asset rather than an alternative hedge.
Pullbacks across equity markets and growth assets have reinforced this correlation, prompting investors to trim exposure to volatile holdings.
Three Short-Term Scenarios
The market is currently weighing three primary trajectories:
- Consolidation between $82,000 - $90,000 if ETF outflow pressure eases and volatility stabilizes.
- Further declines toward the high-$70,000 range if $85,000 repeatedly fails to be reclaimed.
- A technical rebound back to the $90,000 zone if ETF inflows turn positive and demand for option hedges abates.
For now, liquidation heatmaps indicate that the initial deleveraging phase has unfolded. The market’s next directional move will be determined by institutional capital flows, derivatives market structure, and participants’ psychological resilience in the face of extreme volatility.
Disclaimer: This article is for informational and educational purposes only, not financial advice. Cryptocurrency assets are highly volatile and carry significant risk. Always do your own research (DYOR) and never invest more than you can afford to lose.